August 10, 2022
NTD Reporting Just Got A Little Easier

August 10, 2022
NTD Reporting Just Got A Little Easier
August 10, 2022
NTD Reporting Just Got A Little Easier
Transit professionals have a complicated relationship with National Transit Database (NTD) data. On the one hand, there’s a lot to love: NTD data unlocks between 20% and 50% of each transit agency’s annual budget, or a total of $5 billion in federal grants nationwide every year.
Unfortunately there’s a less rosy side of things as well. We hear time and again about the time-consuming, tedious nature of aggregating NTD-related datasets. Agencies often describe spending weeks sourcing data from their CAD/AVL and APC systems, typically in hard-to-use formats, to get the metrics they need. Or as one planner put it more bluntly: “Pulling data for the NTD is the bane of my existence. It’s truly mind-numbing work.” Much less rosy indeed.
That’s why we’re excited to introduce Service Delivery and NTD Reporting Tools, a new set of features that aim to streamline the process of pulling common transit datasets, including those used for NTD reports.
Introducing Swiftly’s Service Delivery and NTD Reporting Tools
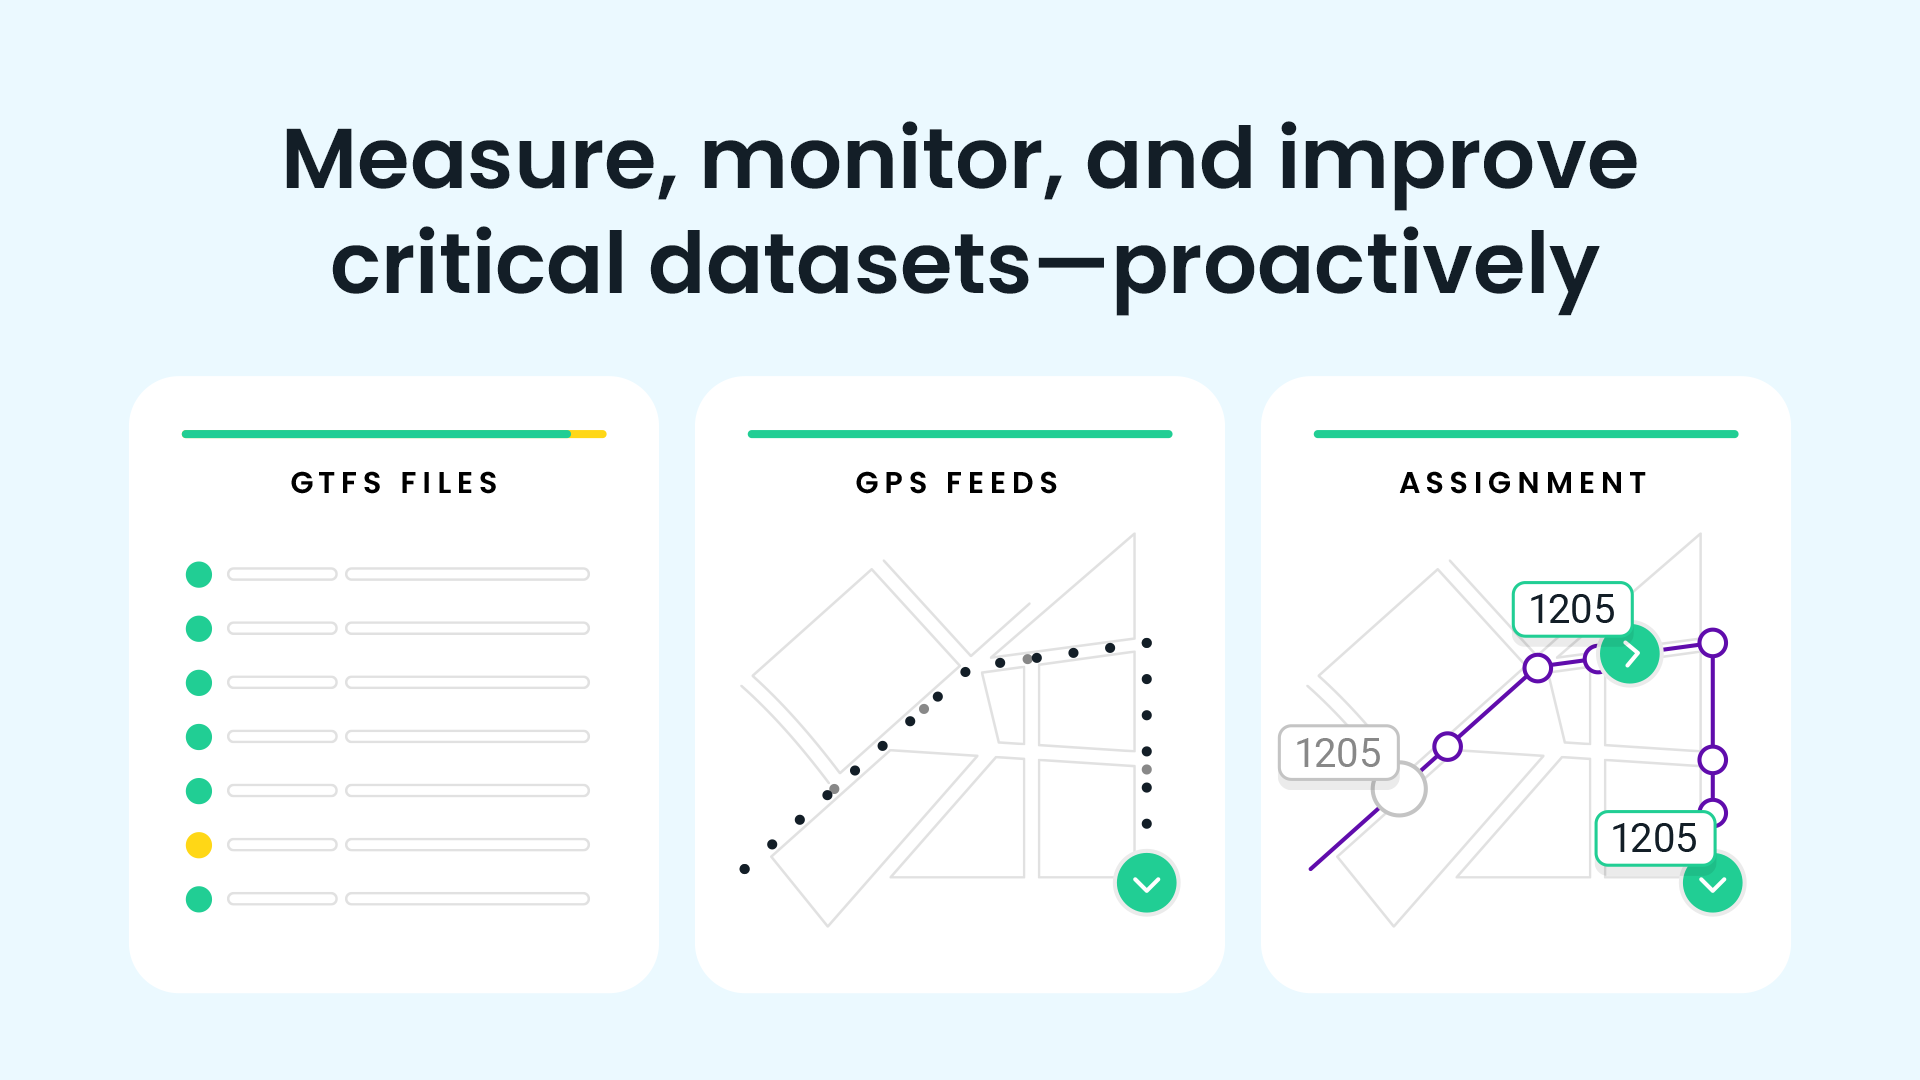
Swiftly’s new Service Delivery and NTD Reporting Tools give agencies easy access to the raw transit data they need for common data applications, including the most important metrics required by the NTD.

Service Delivery and NTD Reporting Tools include three data exports:
1. Missing Trips Dataset:
- The Missing Trips Dataset offers a granular picture of missed service. For every trip in a customizable date range, the Missing Trips report includes the trip’s completion status (missed or partially missed); observed revenue miles; observed revenue hours; and several other important metrics related to missing trips. These are all essential stepping stones to calculating the metrics required in NTD Form S-10. This dataset is also helpful outside of the context of NTD reporting — for example, to understand the impact of canceled service due to operator shortages.
2. Passenger Count Dataset:
- The Passenger Count Dataset provides a report of a transit agency’s ridership, including: number of boardings per stop (recorded by Swiftly’s APC Connector integration) and distance to next stop. These are key ingredients to calculating the unlinked passenger trips and passenger-miles metrics required in NTD Form MR-20.
3. Service Metrics Dataset:
- The Service Metrics Dataset offers top-line summaries of scheduled service versus delivered service, including percentage of all trips that were complete; number of trips that missed stops; number of trips that missed first or last stops; scheduled and observed run-times of all trips; as well as several other important top-level service metrics.
While these reports still require some manipulation before being submitted to the NTD, they automate the most time-consuming aspects of NTD data collection. They’re downloadable in a .csv file format for easy use in Excel or other data processings software, and all datasets are customizable by route and time period. This ease of access is aimed to foster cross-functional collaboration and faster decision making.
And most importantly, we built these datasets with NTD reporting specifically in mind. Our hope is that agencies can bypass their CAD/AVL and APC systems altogether, finding their most important raw NTD-related transit data in one central place.
Beyond the NTD: How Swiftly datasets streamline common workflows
We built these datasets to aid with NTD reporting, but they are by no means limited to NTD applications. Here are other top ways they can help streamline agency workflows:
Service contractor management:
- For agencies using third-party contractors to operate service, these datasets offer a simple way to track the service that contractors actually deliver and any service they may have missed.
Data quality tracking:
- Agencies often want to understand the quality of their data by tracking the data that’s captured at each stop and for each trip. All three datasets offer easy access to highly granular data to see key metrics and how they change over time.
Internal reporting:
- For agencies with KPIs around delivering service, the Missing Service Dataset makes it easy to download this data at regular intervals.
Ready to try it out? Service Delivery and NTD Reporting Tools are now available to all Swiftly users with access to the On-Time Performance product. Reach out for a demo to see how it works!
Request a demo
The rich text element allows you to create and format headings, paragraphs, blockquotes, images, and video all in one place instead of having to add and format them individually. Just double-click and easily create content.
Last Name, Agency

What’s a Rich Text element?
What’s a Rich Text element?
What’s a Rich Text element?
What’s a Rich Text element?
What’s a Rich Text element?
The rich text element allows you to create and format headings, paragraphs, blockquotes, images, and video all in one place instead of having to add and format them individually. Just double-click and easily create content.
Last Name, Agency
Static and dynamic content editing
A rich text element can be used with static or dynamic content. For static content, just drop it into any page and begin editing. For dynamic content, add a rich text field to any collection and then connect a rich text element to that field in the settings panel. Voila!
How to customize formatting for each rich text
Headings, paragraphs, blockquotes, figures, images, and figure captions can all be styled after a class is added to the rich text element using the "When inside of" nested selector system.
- text goes here
- text goes here
- text goes here
- text goes here
- text goes here
- text goes here


