Reliable transit runs on reliable data
200+ transit agencies in 10 countries rely on Swiftly to improve service and the rider experience by putting the industry’s best data at the heart of every decision and every ride.
.webp)

Trusted by 200+ transit agencies worldwide





















CASE STUDIES
Powering the cities that move the world
Transit agencies of all sizes rely on Swiftly’s Transit Data Platform to improve the rider experience, boost service reliability, and operate more efficiently.


MDOT MTA
Better technology for dispatchers and operators
MDOT MTA improved on-time performance by providing dispatchers and operators with access to real-time performance data, both in the operations center and on the bus.
25%
More likely to be on time
37%
Less likely to be early
20%
Drop in early timepoint arrivals

MBTA
We are utilizing technology to give our dispatchers and operators the tools to make timely decisions and deliver improved and more reliable travel for our riders.
Phillip Eng
,
General Manager and CEO


LA Metro
Communicating with riders across every platform
LA Metro uses Swiftly to communicate service adjustments and rider alerts across all platforms, from the agency app to third party apps and signage.
6,400
Adjustments communicated monthly
400
Monthly rider alerts
30+
Real-time data integrations


RTC of Southern Nevada
Communicating disruptions with visitors and local commuters
Swiftly helps the RTC keep riders informed about detours through the busy schedule of events hosted in Las Vegas.
24.5%
Prediction accuracy improvement
1,130
Adjustments communicated monthly
95k
Transit users can view detours


Valley Metro
Targeted changes to improve reliability and efficiency
The scheduling team used Swiftly data and reports to optimize routes, improving on-time performance and eliminating excess run-times
10%
System-wide OTP improvement
20%
Slack eliminated from the schedule
25%
OTP improvement on priority routes
Transit data platform
It all starts with high-quality data
Delivering reliable service starts with data you can trust. Swiftly turns your transit data points into accurate, actionable insights, so agencies can plan, operate, and communicate with confidence.
CAD/AVL
CAD/AVL that just works
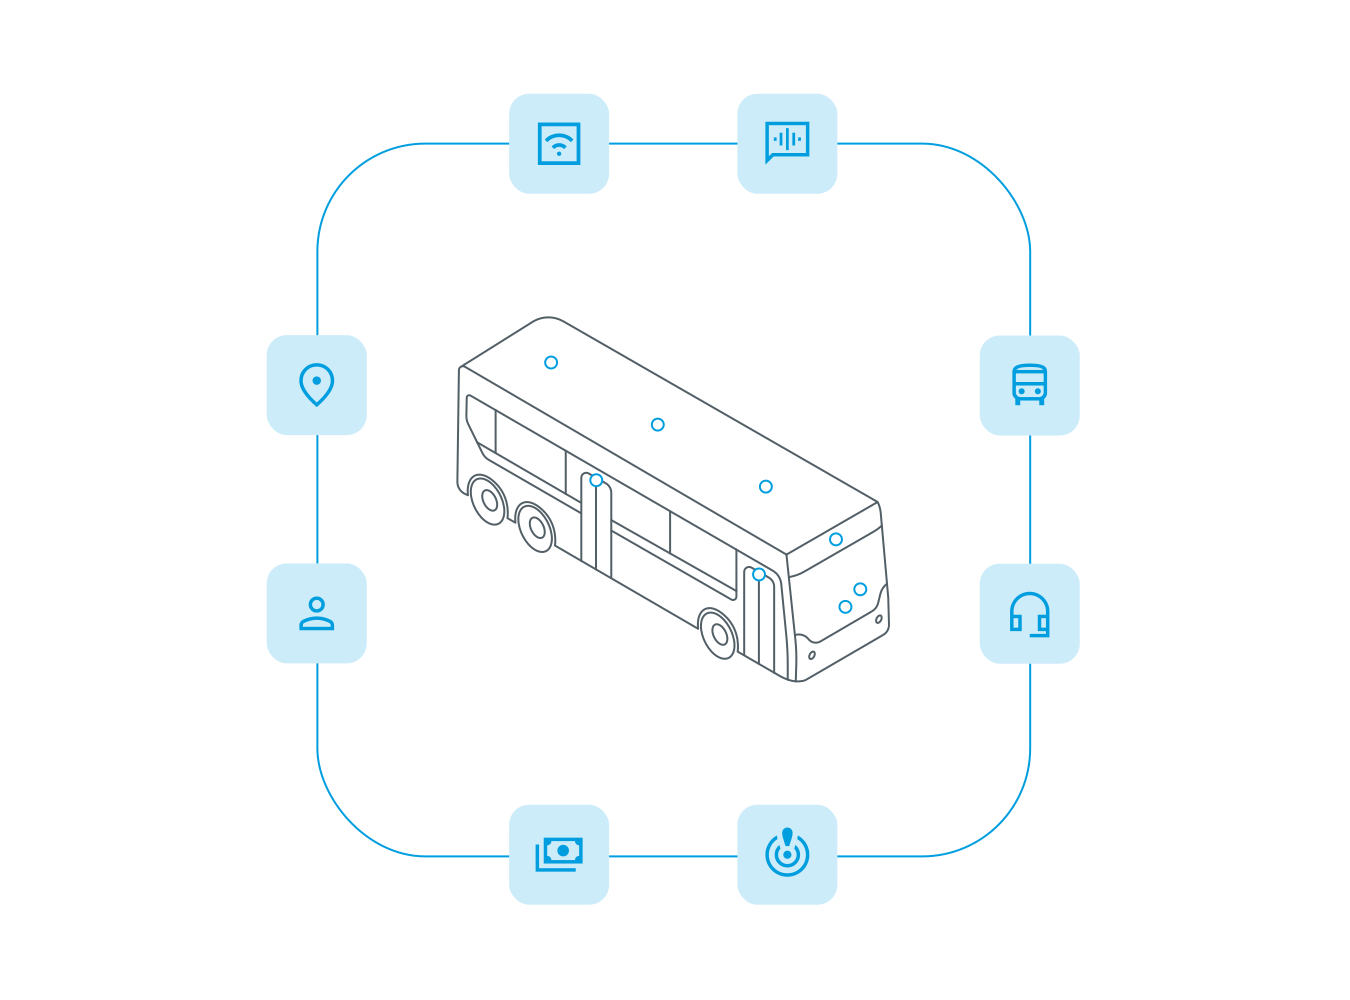
Swiftly CAD/AVL is built from the ground up, using our industry-leading transit data platform as a foundation. The result: a system that every team can trust, technology staff actually want to use, and tools that spur action before problems cascade.
passenger information
Accurate ETAs to build rider confidence
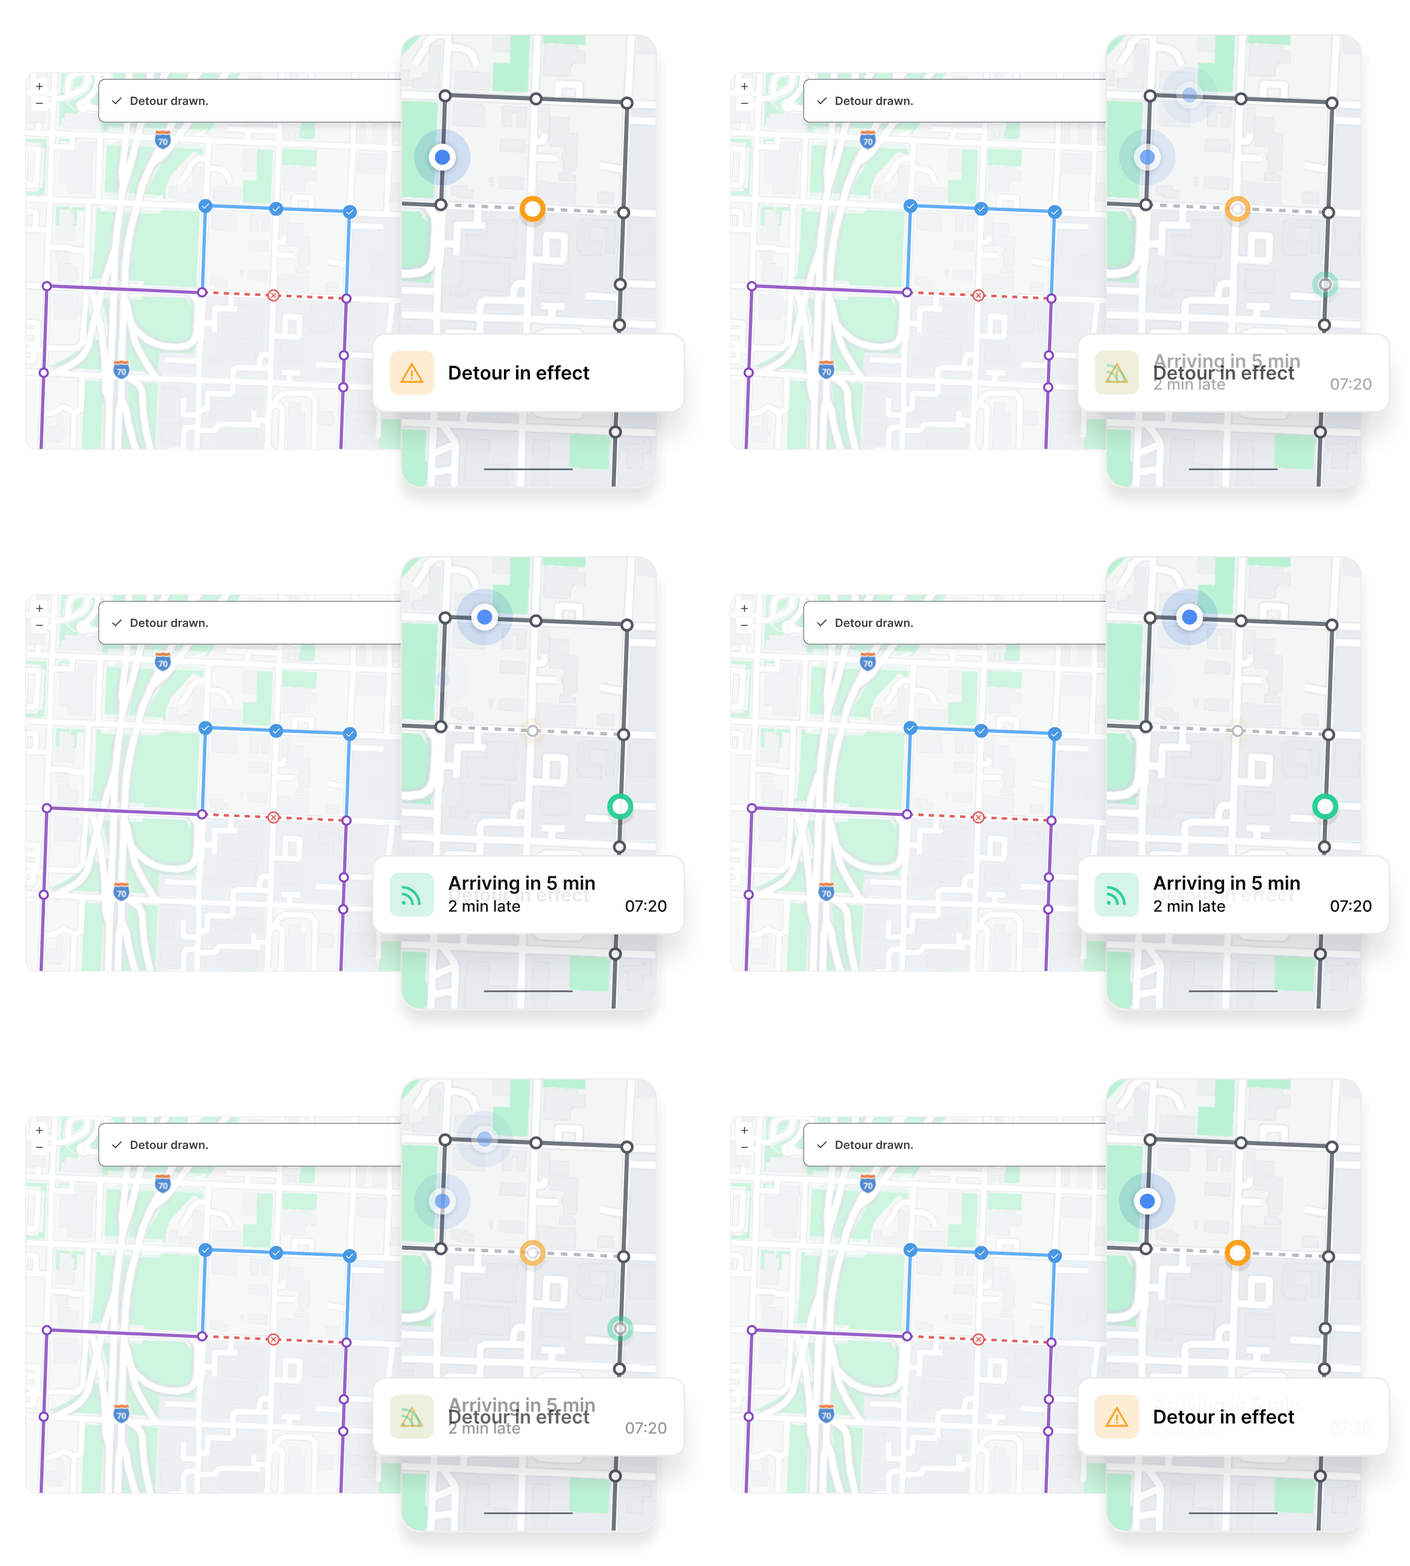
Swiftly’s real-time passenger information is up to 50% more accurate than other providers. Predictions automatically reflect traffic patterns, service disruptions, and live conditions, so riders can trust what they see.
proactive operations
Tools to proactively get in front of service issues
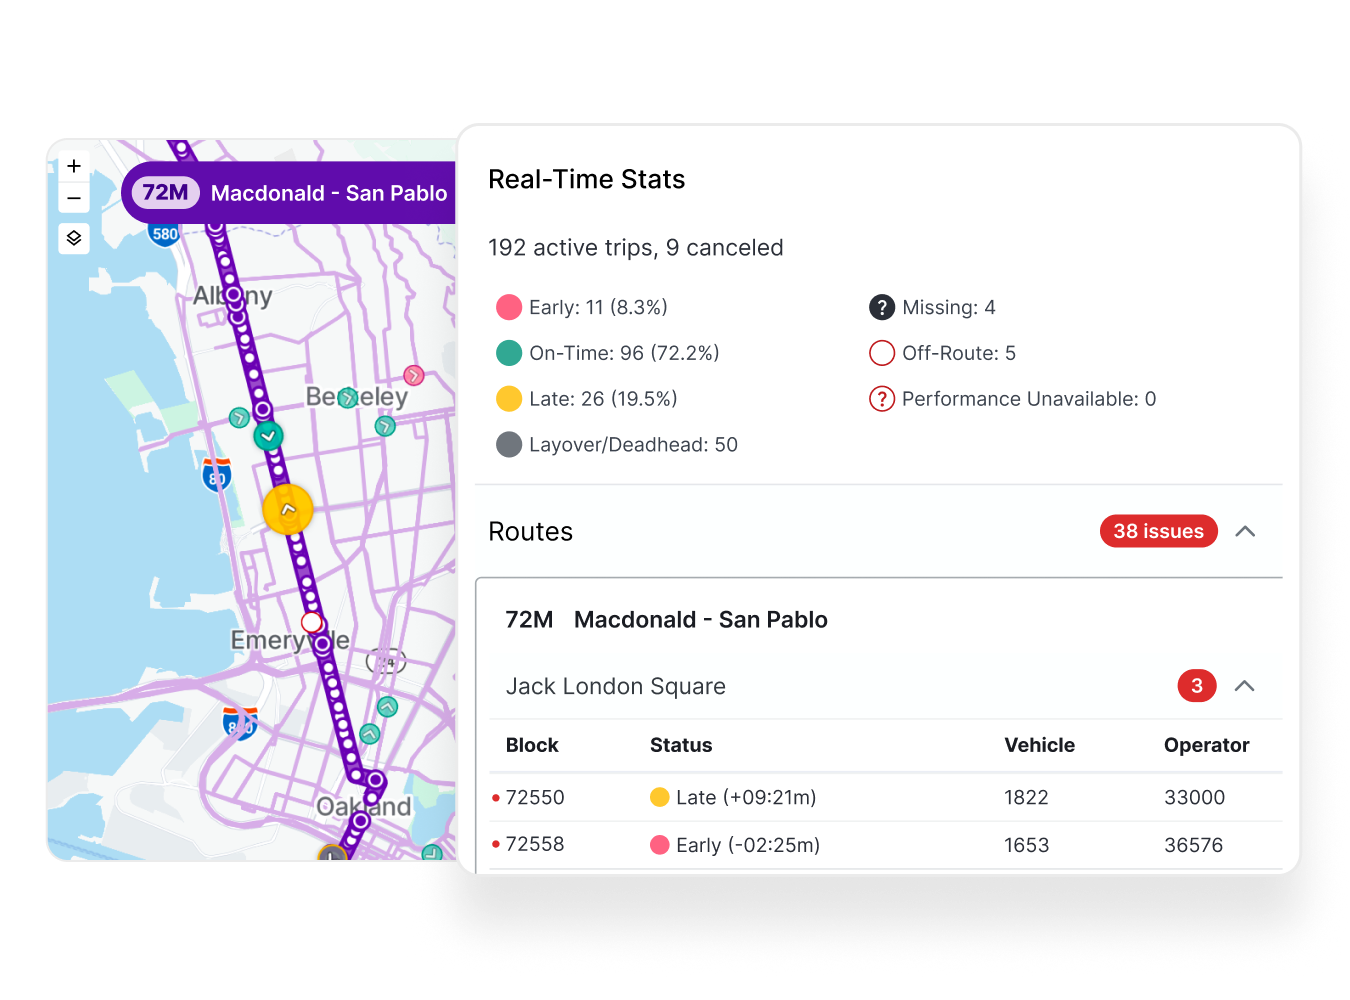
Swiftly gives operations teams a live, continuously updated picture of service performance across the network. Surface the issues that matter most, act on them before they impact riders, and track resolution in real time. Dispatchers solve problems, while operators focus on getting riders to their destinations on time.
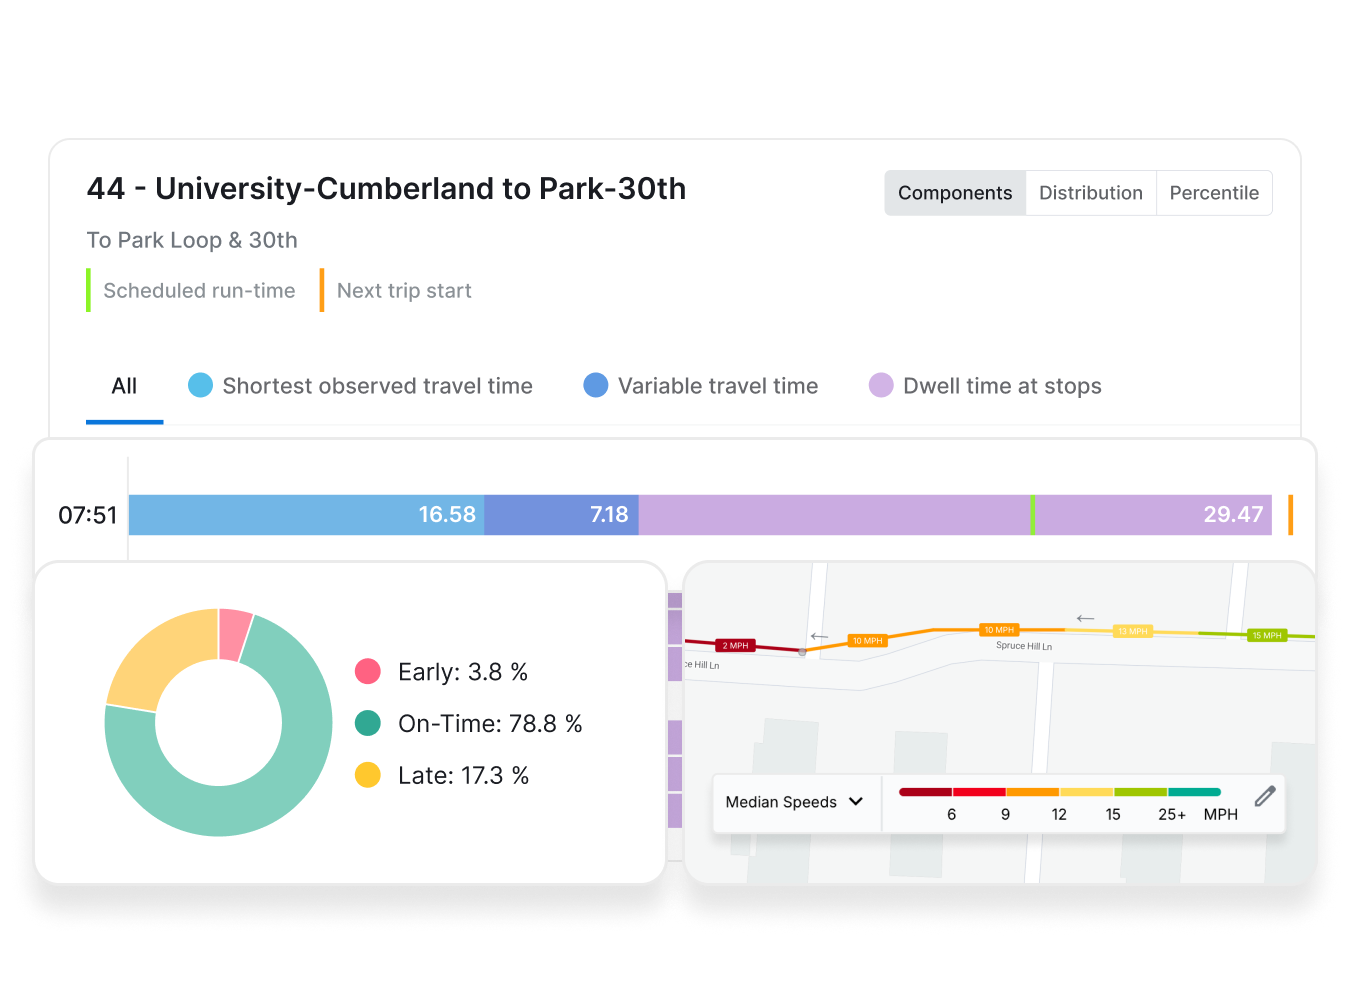
reporting & insights
Beyond analytics—actionable insights
Every insight in Swiftly is built on the same trusted, disruption-aware data that powers live operations. That means what planners and schedulers analyze reflects what happened on the street. Intuitive dashboards surface on-time performance, running times, and operator insights, helping teams move from question to decision up to 10x faster.
.png)

We focus on outcomes that matter
Increase on-time performance
Up to
40%
When dispatchers can spot bunching two stops before riders feel it, schedules hold their shape across the day.
Improve passenger prediction accuracy
Up to
50%
Accurate predictions build rider confidence by keeping arrival times aligned with actual service.
Analyze operational data faster
Up to
10x
Service analyses that once took days now take minutes, leaving more time to solve the problems they uncover.
See what Swiftly can do for your agency
Purpose-built tools for every team
Build rider trust with real-time information
Reliable real-time information builds rider confidence and increases transit ridership.

Riders
Shift from reactive to proactive operations
Handle whatever the day throws at you with Swiftly’s real-time tools.

Operations
Spend time improving service, not pulling data
Ground every planning decision in granular data, not assumptions.
Planning
Optimize schedules for real-world travel times
Give schedulers a detailed picture of real-world performance.

Scheduling
Answer customer calls in a tenth of the time
Cut down on complaints and help staff resolve the remaining calls even faster.

Customer Service
Modernize your transit technology
Equip teams with reliable data and modern tools—without compromising security and platform reliability.
IT
Respond to and prevent safety incidents
Give staff the right information at the right time to resolve incidents quickly, keeping staff and riders safe.

Safety